Expand SPSS Base's capabilities for the data analysis stage in the analytical process. Using SPSS Advanced Models with SPSS Base gives you an even wider range of statistics so you can reach the most accurate response for specific data types. It easily plugs into SPSS Base so you can seamlessly work in the SPSS environment.
General linear models (GLM): GLM gives you flexible design and contrast options to estimate means and variances and to test and predict means. For example, a financial service company might want to know what predicts account balance for various account types. You can also mix and match categorical and continuous predictors to build models. Because GLM doesn't limit you to one data type, you have options that provide you with a wealth of model-building possibilities.
A technology company examining the deal sizes between products and customer type can test two types of effects using GLM multivariate:
Linear mixed models, also known as hierarchical linear models (HLM): If you work with data that display correlation and non-constant variability, such as data that represent students nested within classrooms or consumers nested within families, use the linear mixed models procedure to model means, variances, and covariances in your data. For example, educators can discover how different teaching methods affect student test scores across classrooms. Its flexibility means you can formulate dozens of models, including split-plot design, multi-level models with fixed-effects covariance, and randomized complete blocks design. You can also select from 11 non-spatial covariance types, including first-order ante-dependence, heterogeneous, and first-order autoregressive. You'll reach more accurate predictive models because it takes the hierarchical structure of your data into account.
You can also use linear mixed models if you're working with repeated measures data, including situations in which there are different numbers of repeated measurements or different intervals for different cases or both. For example, a healthcare organization testing patients recovering from illness might not have uniformly collected data. Ideally, the organization would test individuals at regularly scheduled intervals (for example, every 90 days). But people often miss appointments or are tested earlier or later than the optimal time. More standard procedures will discard data not meeting test conditions. Linear mixed models, however, will use all your data�giving you a more accurate picture of patient recovery.
PoLytomous universal model (PLUM): Make predictions with ordinal responses. For example, you might want to know customer satisfaction level (very dissatisfied, somewhat dissatisfied, somewhat satisfied, or very satisfied) to understand customer loyalty. When you need to predict ordinal-dependent variables, PLUM gives you a versatile method for model building. When you choose different link functions, you have the flexibility to fit ordinal logistic regression, ordinal probit models, and ordinal Cauchit models. You can also model both the location and scale of the underlying distribution. PLUM gives you options to save predicted probabilities for all dependent variable categories back to your data.

Click on image to enlarge.
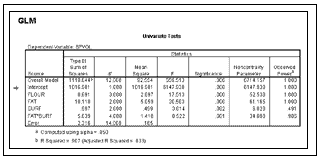
Get more versatility with the GLM procedure. The analysis of variance table is one of the two tables of results. In this example, the F value for the interaction effect of fat*surfactant treatment is 8.522, which is significant at the p < .05 level.
Predictive Analytics
can make your organization
more
successful
Key Products and Services
Resources
Buy
Demos and Downloads