
With AnswerTree Server, you can apply AnswerTree's interactive data mining approach to much larger datasets than using the stand-alone AnswerTree product. AnswerTree Server's scalable architecture reduces the time needed to solve enterprise-sized problems.
The benchmarks below provide results that give you an indication of the degree of scalability achieved with AnswerTree Server.
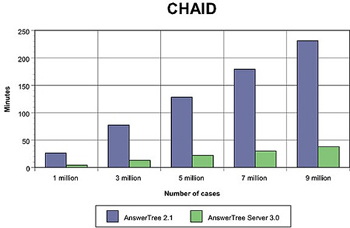
As the graph below shows, AnswerTree Server can perform CHAID algorithms more than 80% faster than using the stand-alone AnswerTree product.
Click to View Larger Image
| AnswerTree 2.1 | AnswerTree Server 3.0 | |
|---|---|---|
| 1 million | 26 | 4 minutes |
| 3 million | 77 | 13 minutes |
| 5 million | 128 | 22 minutes |
| 7 million* | 179 | 30 minutes |
| 9 million | 231 | 38 minutes |
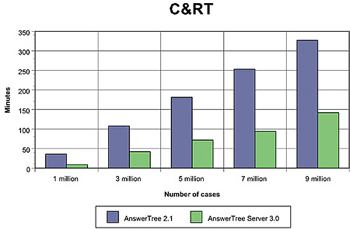
With AnswerTree Server, you can perform C&RT; algorithms in less than half the time than the stand-alone AnswerTree product.
Click to View Larger Image
| AnswerTree 2.1 | AnswerTree Server 3.0 | |
|---|---|---|
| 1 million | 36 | 9 minutes |
| 3 million | 108 | 42 minutes |
| 5 million | 181 | 72 minutes |
| 7 million* | 253 | 94 minutes |
| 9 million | 327 | 142 minutes |
The performance tests used a nominal (binary) target variable and 30 predictor variables. The nominal target variable had two categories and the predictors included variables of all three measurement levels - nominal, ordinal, and continuous. The tests were performed by running production mode scripts for the different case intervals on the CHAID and C&RT; algorithms. Both versions of AnswerTree were run on the same computer, the only difference was the operating system.
AnswerTree 2.1 and AnswerTree Server 3.0 were executed with dual 800 MHz processors, 1GB RAM, and 28.6 free disk space on the SCSI drive on which the temp directory exists. The operating system for AnswerTree 2.1 stand-alone was Windows NT Workstation 4.0 and the operating system for AnswerTree Server 3.0 was Windows NT Server 4.0. Note: The Server tests were conducted in the absence of network traffic and of other server activity that might occur in a normal environment.
*The numbers for the 7 million intervals were calculated from taking the average number of minutes per million records from the 1, 3, 5, and 9 million intervals and then multiplied by 7 (which allows you to extrapolate for further intervals as well). For example: To derive the 7 million number for running CHAID on AnswerTree Server 3.0, we take the total average across the board of 4.23 minutes/million records for CHAID on AnswerTree Server 3.0. Then, we take 7 million records x 4.23 minutes/million records = 29.61 minutes � 30 minutes. The same procedure was used for the remaining three intervals of 7 million records.
Predictive Analytics
can make your organization
more
successful
Key Products and Services
Resources
Buy
Demos and Downloads